Executive Summary
In this paper, the authors suggest a taxonomy of business models used by startups that rely on data as a core resource for their business, which they define as data-driven business models (DDBMs). The end goal of these businesses is not simply to collect, store and analyze data, but it is to create actual business value. Usually, data creates value by improving and optimizing current business practices and services or by launching new products and business models.
This paper is important for managers as the availability of potentially valuable data is growing exponentially because of the rise of the Internet, social media, cloud computing and mobile devices. This phenomenon is often referred as big data which is most commonly defined as “high-volume, high-velocity and high-variety information assets that demand cost-effective, innovative forms of information processing for enhanced insight and decision-making” (Gartner, 2012). A fourth dimension, “veracity”, is often added to address the uncertainty and reliability of certain data type.
Defining Data-Driven Business Models
The DDBM framework consists of six dimensions: key resources, key activities, value proposition, customer segments, revenue model and cost structure.
1. Key Resources — Data Sources
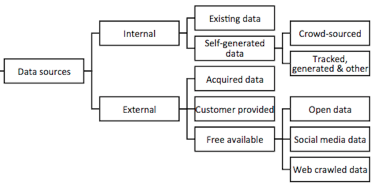
In the strategic management world, a resource is defined as “anything that could be thought of as strength or a weakness of a given firm” (Wernerfelt, 1984) or more specifically “all assets, capabilities, organizational processes, firm attributes, information, knowledge controlled by a firm” (Barney 1991). In the case of DDBM, key resources represent what kind of data and all the other resources that the company is using.
- Internal data sources include data that already exists in or is created through existing IT systems (ERP, CRM, etc.) and data generated for a specific purpose like crowdsourced Web data.
- External data sources include data acquired from data providers, freely available data and sometimes businesses can leverage customers data that they collect or that is shared by the customer.
2. Key Activities
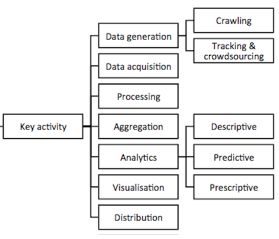
In classical strategic management, the key value-creating activities can be described using the value chain of Porter. However, the concept is geared toward the physical world and information is just a supporter. In our case, information is the source of value itself. The virtual value chain can be defined as gathering, organizing, selecting, synthesizing, and distributing data.
- Generation: Manually by humans, automatically through the use of tools or by using a mix of both;
- Acquisition: Either gather data internally or obtain data from external sources;
- Processing: Data can be transformed, cleaned or processed;
- Aggregation: Data can also be aggregated before being analyzed;
- Analytics: Descriptive analytics explain the past, predictive analytics predict/forecast future outcomes and prescriptive analytics try to suggest decisions;
- Visualization: Data can be visualized through tools like Tableau or programming languages like R.
- Distribution: Usually data is distributed through an API.
3. Offering/Value Proposition
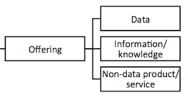
A value proposition can be defined as the value created for customers through the offering or as “ the expression of the experience that a customer will receive from a supplier’s measurably value-creating” (Barnes et al., 2009). In the case of DDBM, company can offer raw data, data with interpretation (information/knowledge) or they can simply offer a service which is supported by data-intensive activities.
4. Customer segments
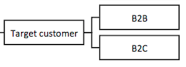
Usually companies either target B2B or B2C companies, but it’s quite possible that they could target both.
5. Revenue Model
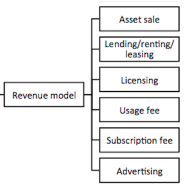
- Asset Sale: Giving away the ownership rights of a good or service in exchange for money;
- Lending/Renting/Leasing: Granting someone the exclusive right to use an asset for a defined period of time;
- Licensing: Granting permission to use a protected intellectual property in exchange for a fee;
- Usage fee: Fee charged for the use of a particular service;
- Subscription fee: Fee charged for the use of the service;
- Brokerage fee: Fee charged for an intermediate service;
- Advertising: Promoting a product or a service.
6. Cost Structure
Here, the authors looked if a firm had a specific cost advantage regarding the use of data. According to the authors, a company would have a cost advantage if the data used is created independently of the offering.
Results— How Companies Are Using Data ?
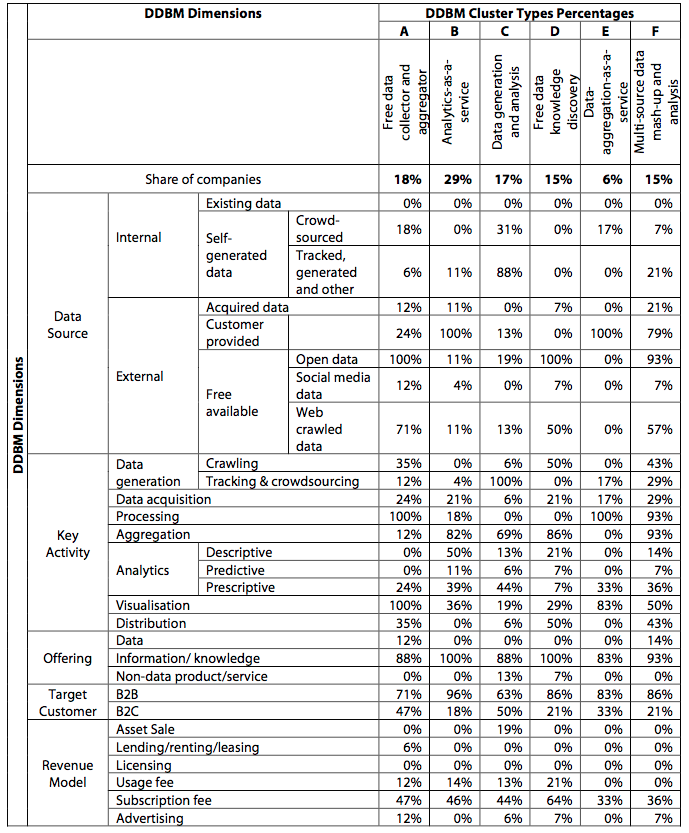
The table above is pretty extensive but here aresome highlights of what the authors found:
- 73% of the companies use only external data sources, 11% use only internal sources and 16% use a mix of both;
- 76% of the companies conduct analytics as a key activity, but only 22% do predictive analytics and 6% prescriptive analytics;
- 62% of the companies rely on subscription (SaaS) while 20% rely on a usage fee-based model (transaction calls);
- Over 80% of the companies target business customers with 70% only B2B and 13% both B2B and B2C.
Furthermore, companies can be grouped in a 3x3 matrix based on the key data sources they use and the key activities they are involved in.
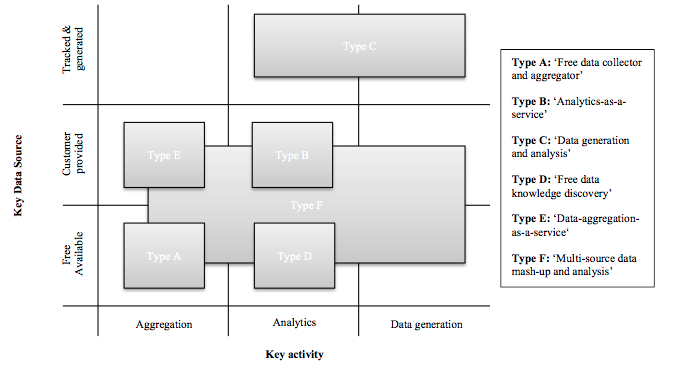
Type A: Free Data Collector and Aggregator
Companies of this type collect and aggregate data from a vast number of available data sources (social media, proprietary acquired or crowdsourced data). They then distribute the data through APIs or allow access through a Web-based dashboard with visualization capabilities.
Type B: Analytics-as-A-Service
Companies of this type conduct analytics on data provided by their customers, but they might also include other data sources. They then distribute the results through APIs or visualization.
Type C: Data Generation and Analysis
Companies of this type generate data themselves through crowdsourcing, Web analytics or through connected devices (smartphones, sensors) rather than relying on existing data. Most of the companies also perform analytics on this data.
Type D: Free Data Knowledge Discovery
Companies of this type use and analyze freely available data. Since not all free data sources are available in a machine-readable format, some companies will crawl/scrape data from the Web.
Type E: Data-Aggregation-as-A-Service
Companies of this type aggregate data from multiple internal sources for their customers (from different internal sources or from individuals within an organization). They then distribute the aggregated data through APIs or visualization.
Type F: Multi-Source Data Mash-Up and Analysis
Companies of this type aggregate data provided by their customers with other external available data sources and perform analytics on the data. This type is specifically characterized by their usage of external data to enrich customer data.
Conclusion
This paper provides a framework to help data-intensive business to position themselves in the competitive landscape and identify potential business gaps. The paper identifies the sources of data that can be used, the key activities that a business might be involved in and the revenue models that can be used to commercialize data. In conclusion, it is important to remember that startups have the advantage that they can build their IT systems from scratch and don’t face the challenge of legacy IT systems. However, established companies can use data sources that they already own and that they have produced throughout their history.